
Improve Your Lakebase Usage Posture
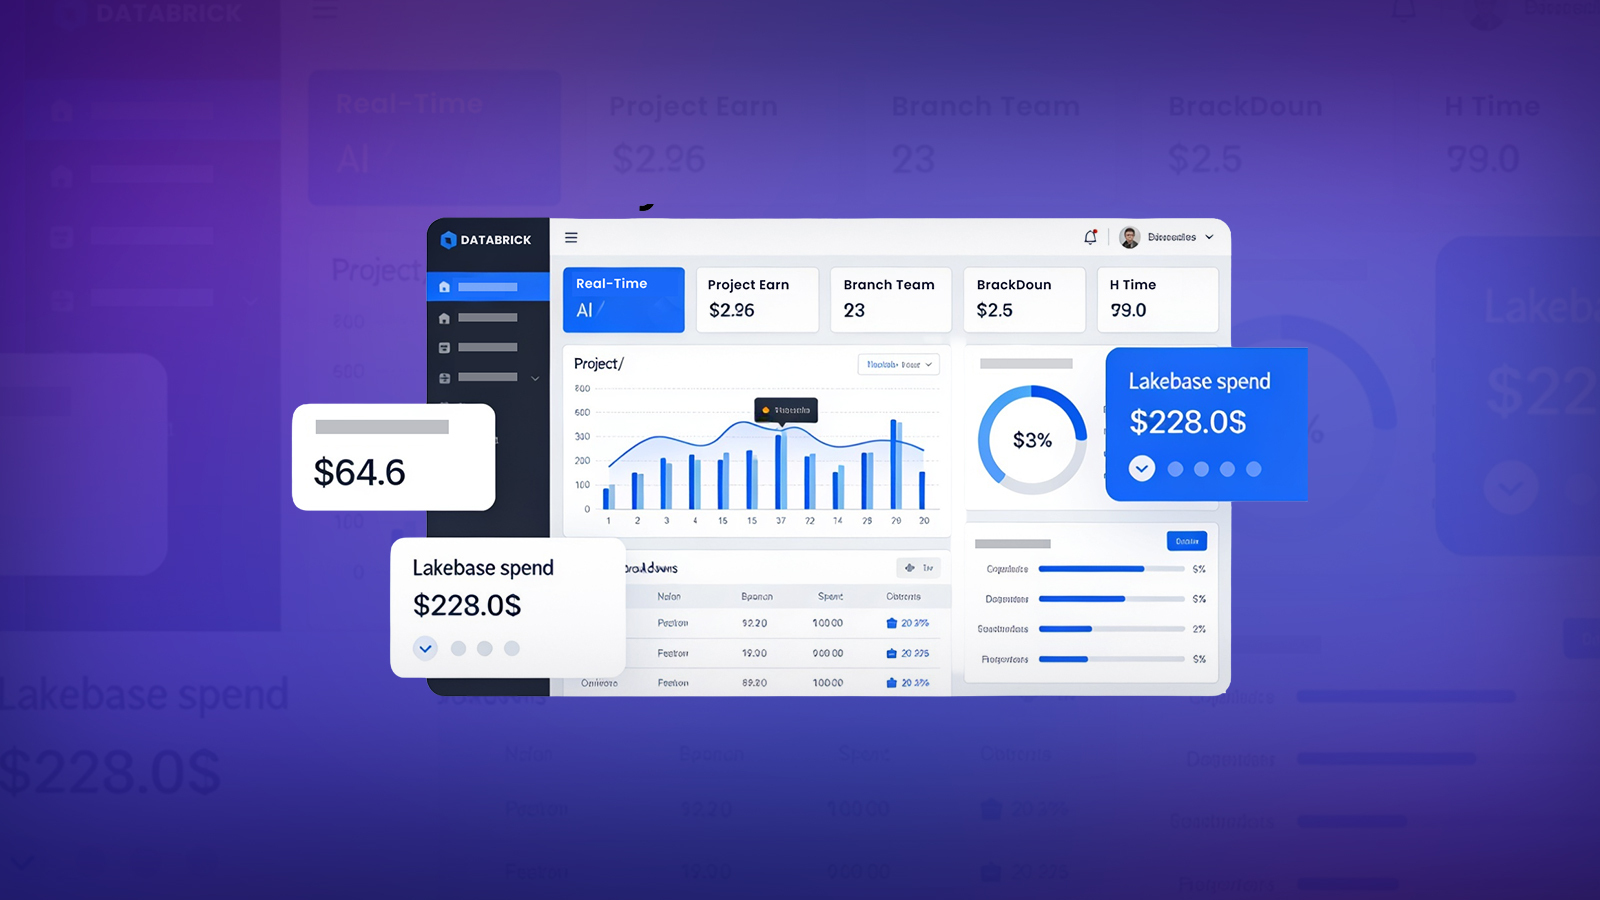
Lakebase integrates Postgres-compatible OLTP databases into Databricks with branching that allows separate database copies for development, testing, and experimentation. As more branches are created, teams can lose track of ownership, activity, storage, and costs. v4c’s Lakebase Monitoring Dashboard Accelerator brings all this information together in a native Databricks SQL dashboard, enabling teams to monitor branch health, manage costs, and improve compliance without additional tools.
Why Choose the Lakebase Monitoring Dashboard Accelerator?
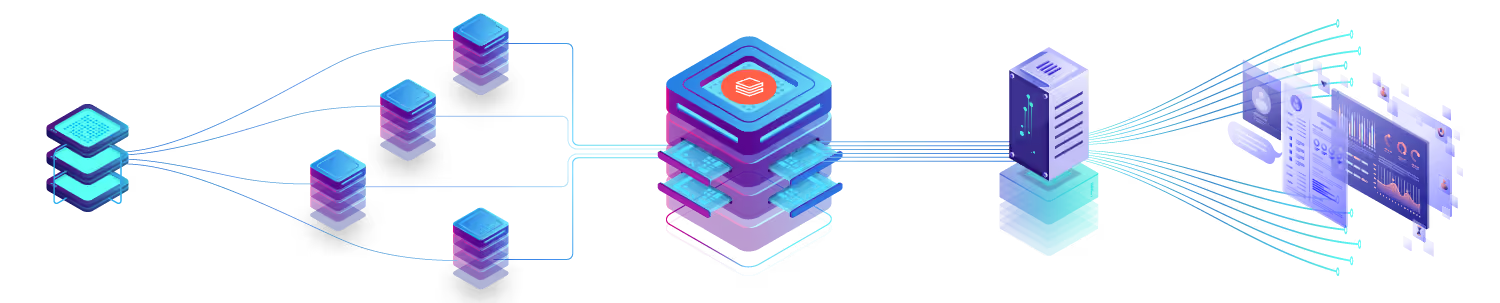
v4c’s Lakebase Monitoring Dashboard Accelerator turns the ‘Git-style’ branch sprawl into clear visibility. It reveals dormant assets and compute trends to help lower costs early. The dashboard further includes a single governance perspective with centralized audit logs and history in Databricks, providing unified governance and auditability.
This provides a secure log for compliance and removes the need to manually parse logs. It is fully implemented in Databricks by leveraging SQL views into system tables. The accelerator offers fast, on-demand tracking of cost, health, and compliance.
This provides a secure log for compliance and removes the need to manually parse logs. It is fully implemented in Databricks by leveraging SQL views into system tables. The accelerator offers fast, on-demand tracking of cost, health, and compliance.
Schedule a Demo
Layered Architectural Design
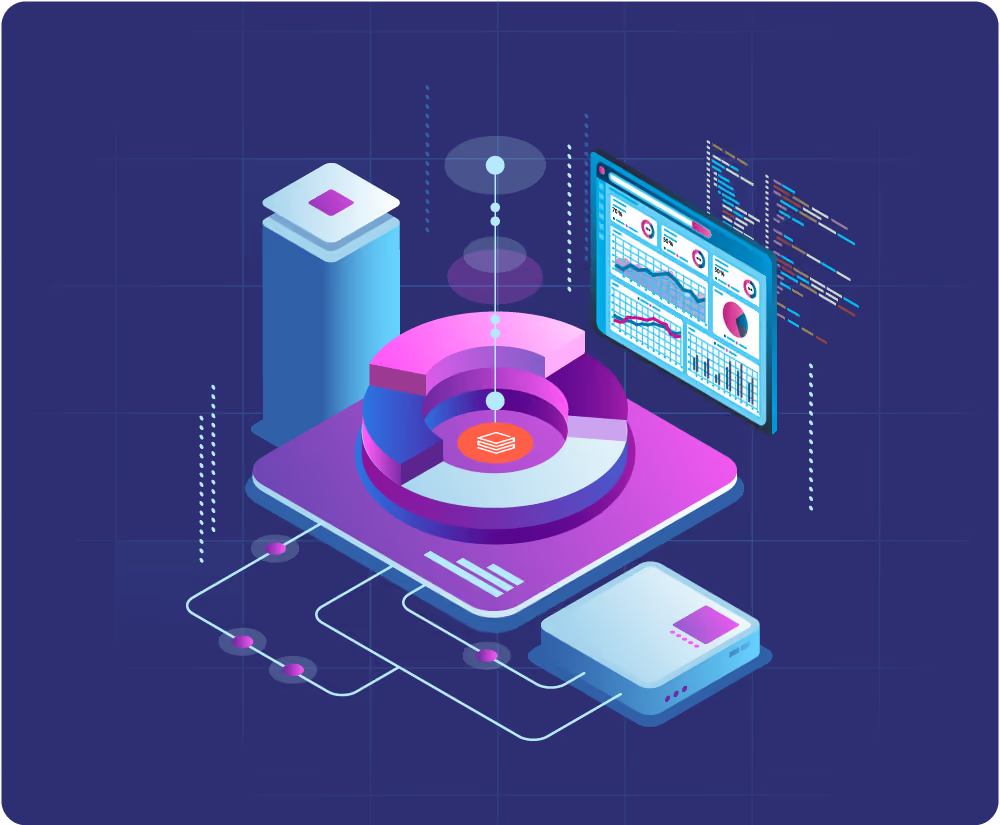
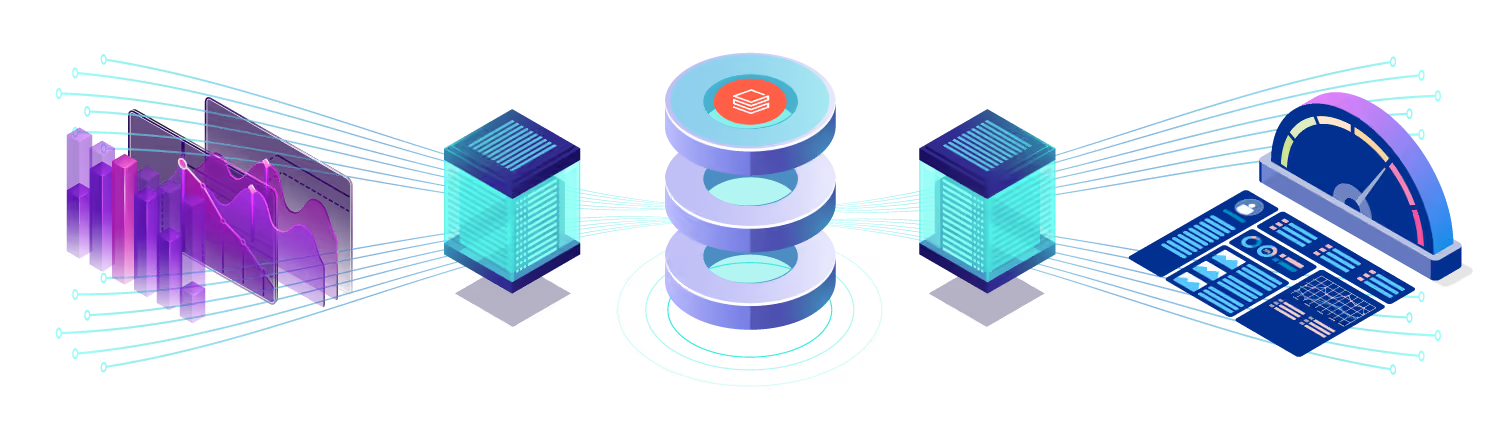
The Lakebase Monitoring Dashboard Accelerator uses a three-layer architecture to provide operational visibility into Lakebase. A Python notebook calls the Lakebase REST API and adds the response to a Delta table, creating a real-time series history of branch activity. SQL views built on the Delta table and system tables manage business logic, derived metrics, and thresholds that are queried by the Databricks SQL dashboard to display KPIs and provide operational visibility in Lakebase.
Know More

.svg)
.svg)
What You Get with the Lakebase Monitoring Dashboard?

Branch Health
Get a live view of every branch in the project allowing you to review branch state, storage, expiry, inactive branches, and storage by activity status.

Lakebase Cost & Compute
Track daily DBU trends, total estimated cost, compute configuration per branch, and API activity grouped by multiple operations.

Audit & Governance
Compliance and security review support with project and user-level filtering, total operation counts, flagged high-risk operations, activity trends, and a scrollable 30-day audit log.

Proactive Cost Management
Identify active, idle, and high-autoscaling compute configurations early to stop unmonitored branch sprawl from driving up your cloud costs.

Native Databricks Integration
Deploy seamlessly in Databricks with Unity Catalog system and Delta tables, eliminating third-party lock-in, external dependencies, and software licensing costs.

Granular Access Control
Provide security teams with actionable traceability for privileged operations by tracking specific user details over a given timeframe and workspace projects.

Resources
Explore the latest news and insights
.png)


Let’s Get Started
Ready to transform your data journey? v4c.ai is here to help. Connect with us today to learn how we can empower your teams with the tools, technology, and expertise to turn data into results.
Get Started
