Building a Lakebase Monitoring Dashboard in Databricks
.png)
Introduction
Databricks Lakebase brings Postgres-compatible OLTP databases directly into the Databricks platform. One of its most powerful features is branching, which lets teams create isolated copies of a database in seconds for development, testing, or experimentation. But as the number of branches grows, it becomes harder to keep track of which ones are active, how much storage they are using, and what they are costing.
This blog walks through a solution accelerator built at V4C that addresses exactly this problem. The accelerator provisions a Lakebase project, sets up branches, pulls data from Databricks system tables and the Lakebase REST API, and builds a monitoring dashboard directly inside Databricks SQL.
The Problem
Monitoring a Lakebase environment is harder than it sounds because the data you need lives in two completely separate places.
- Databricks system tables. Tables like system.billing.usage, system.access.audit, and system.lakeflow.job_run_timeline contain billing data, audit logs, and job run history. These are queryable using standard SQL.
- Lakebase REST API - Information about branch lifecycle, endpoint state, storage size, and expiry times is only available through API calls to the Lakebase control plane. There is no system table that gives you this data directly.
Without connecting these two sources, teams are left making decisions without visibility into how their branching activity is affecting cost, storage, and compliance.
Architecture
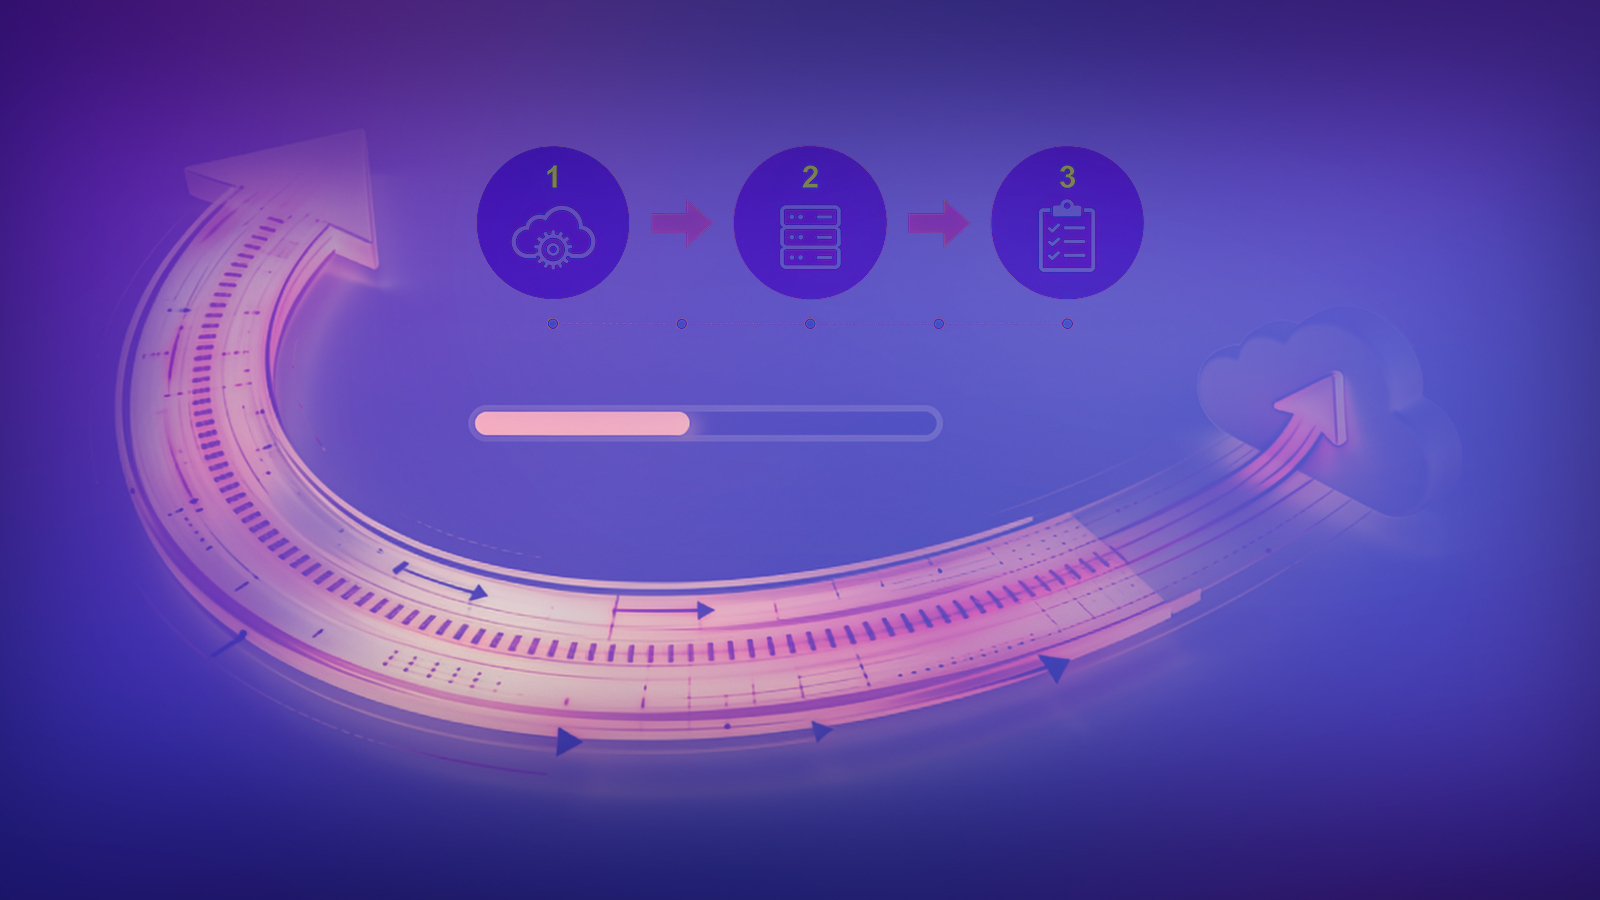
The solution uses a simple three-layer design.
- The first layer is a Python notebook that calls the Lakebase REST API on a schedule. It fetches the current state of all branches and endpoints, flattens the response into rows, and appends them to a Delta table called lakebase_branch_snapshots inside a Unity Catalog schema called lakebase_monitoring. Running this notebook on a schedule (every 15 to 60 minutes) builds a time-series history of branch activity.
- The second layer is a set of SQL views built on top of both the Delta snapshot table and the Databricks system tables. These views do the heavy lifting, applying thresholds, computing derived metrics, and joining data across sources.
- The third layer is a Databricks SQL dashboard that queries these views. Because the dashboard reads from views rather than hitting the REST API directly, it loads quickly and stays stable even if the API changes.
Delta Tables
lakebase_branch_snapshots
This is the core storage table. Each time the notebook runs, it appends one row per branch endpoint. The table captures branch state, endpoint state, storage size in bytes, last active time, expiry time, and compute unit configuration. Because rows are appended rather than overwritten, the table gives you a historical record that you can use for trending.
active_projects_filter
This table holds project-level metadata fetched from the Lakebase REST API. It stores project IDs, display names, owner emails, Postgres version, and compute scaling limits. It is used to power the project-level filter in the dashboard and to ensure that branch telemetry is always linked back to a named project owner.
SQL Views
vw_branch_snapshot
A pass-through view over lakebase_branch_snapshots that shows the most recent row per branch. It converts logical_size_bytes to gigabytes and normalises the last_active_time field, treating API epoch-zero timestamps (2000-01-01) as null to correctly identify branches that have never been used.
vw_branch_snapshot_resolved
Built on top of vw_branch_snapshot, this view adds business logic. It computes an activity_status for each branch, classifying it as ACTIVE, INACTIVE, NEVER_ACTIVE, EXPIRING_SOON, or EXPIRED based on last active time and expiry date. It also applies a storage threshold check and flags branches that exceed the configured limit with an OVER_LIMIT status. This view directly powers the branch status table and storage charts in the dashboard.
vw_inactive_branches
Filters vw_branch_snapshot_resolved to show only branches with a non-healthy activity status, excluding the default production branch. Ordered by time since last activity, this view gives infrastructure teams a clear list of branches to review and potentially delete.
vw_lakebase_audit
Queries system.access.audit filtered to service_name = postgres. Returns the raw event log of all Lakebase API calls made in the workspace over the last 30 days, including event time, actor, action name, status code, and error message.
vw_lakebase_audit_resolved
Built on vw_lakebase_audit, this view strips out routine read operations like listBranches and getProject to surface only structural changes. It highlights high-risk actions such as changeProjectAcl and generateDatabaseCredential, which are relevant for security audits and compliance reviews.
vw_dbu_daily
Joins system.billing.usage with system.billing.list_prices to compute estimated dollar cost per day per billing product. Filtered to the last 30 days. Used in the cost page of the dashboard.
vw_dbu_by_sku
Aggregates billing usage by SKU name and billing product to show a breakdown of where compute spend is going across the workspace.
vw_cluster_cost
Joins billing usage with system.compute.clusters to show top clusters by DBU consumption along with their owner and cluster type.
vw_job_cost
Joins system.lakeflow.job_run_timeline with billing usage to show job run cost and duration trends over the last 30 days.
The Dashboard
The dashboard is built in Databricks SQL using the native AI/BI (Lakeview) dashboard editor. It has three pages.
Branch Health
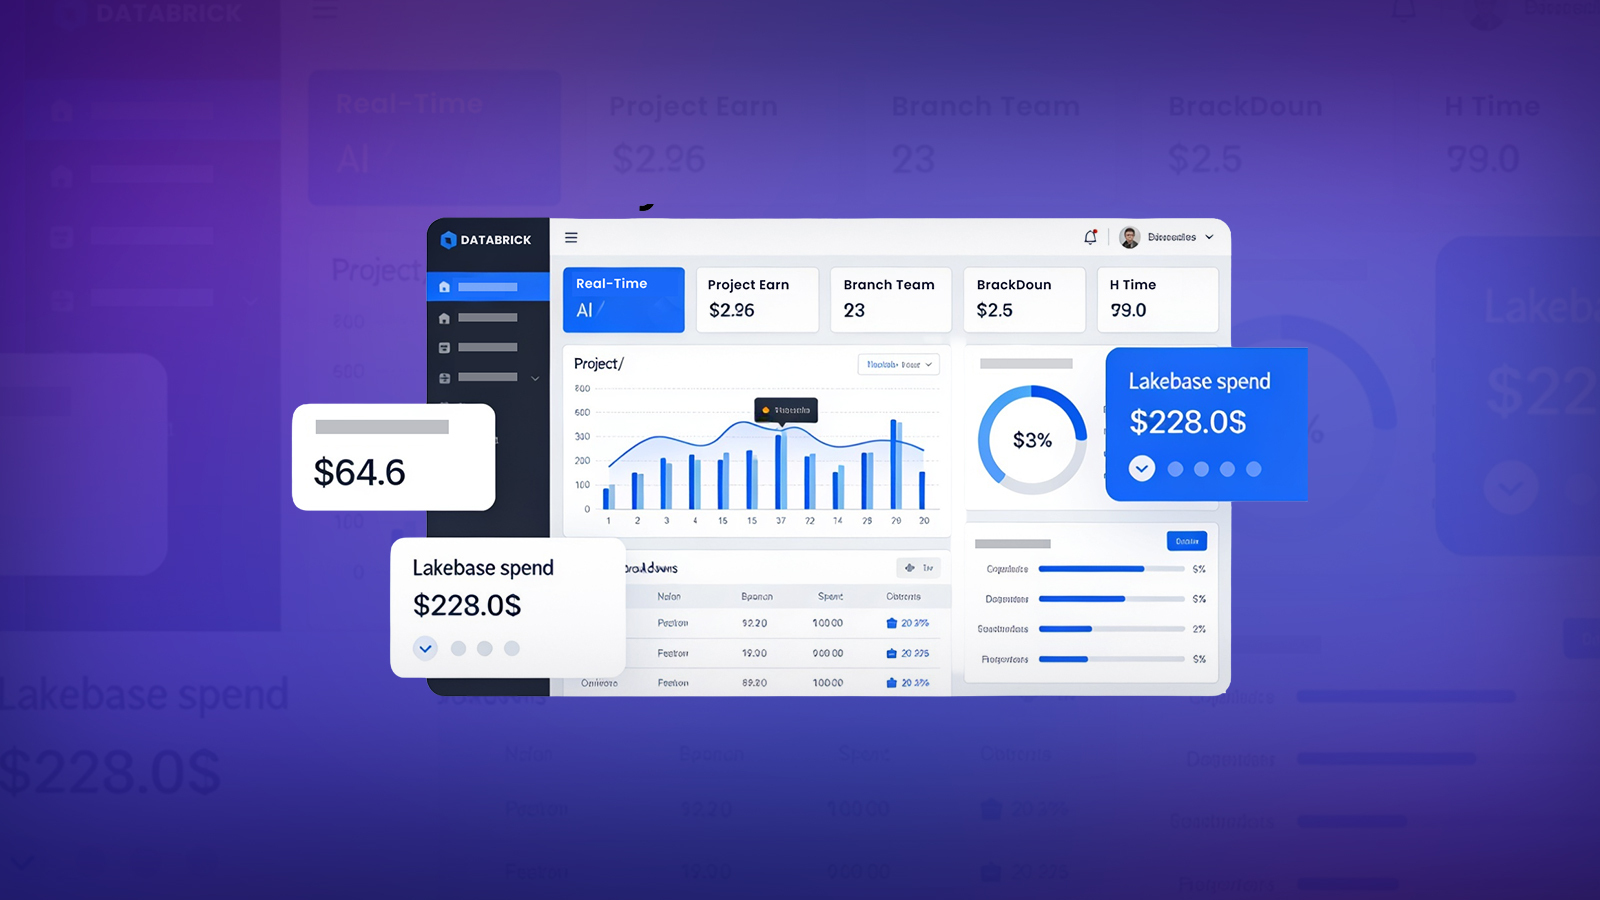
This page gives a real-time view of all branches in the project. At the top, three counter widgets show total branch count, number of branches needing attention, and the last active date of the production branch. Below that, a full branch status table shows state, endpoint state, activity status, storage size, last active time, and expiry time for every branch. An inactive branches table below it lists cleanup candidates. A bar chart shows storage size per branch coloured by activity status.
Lakebase Cost and Compute
This page focuses on Lakebase-specific spend. Two counters show total estimated cost in USD and total Lakebase DBU consumed over the last 30 days. A bar chart shows daily Lakebase DBU consumption over time. A second bar chart shows compute unit configuration per branch, giving visibility into which branches are configured for higher autoscaling limits. A final chart groups all Lakebase API activity into five categories: Branch Operations, Endpoint Operations, Project Operations, Database Operations, and Snapshot Operations.
Audit and Governance
This page gives compliance and security teams full visibility into all Lakebase API activity across the workspace. It supports project-level and user-level filtering, making it easy to drill into specific environments or individual actors. Key widgets surface total operation counts, a breakdown of actions by category, high-risk operations such as access control changes and credential generation, user activity trends over time, and a full 30-day scrollable audit log with actor-level detail.
Conclusion
The Lakebase monitoring accelerator built by V4C.AI gives Databricks teams a practical starting point for operational visibility into their Lakebase environment. By combining the Lakebase REST API with Databricks system tables and surfacing everything through a SQL dashboard, it covers the key areas that matter in production: branch health, cost attribution, and audit compliance.
The notebooks and views are designed to be run incrementally and are idempotent, making them straightforward to adapt for different catalogs, projects, or threshold configurations. The step-by-step build process also makes it easy to extend, whether that means adding more system table sources or packaging everything into a Databricks Asset Bundle for deployment across workspaces.
More blog posts